A water rocket project is one of the most rewarding experimental activities in a physics class: cheap materials, a visible result and students who take part without needing to be persuaded. For whoever does the planning, though, the problem is a different one: how to justify it within curriculum coverage, how to spread it across the year, and how to assess it with criteria that will survive a review by the head of studies.
This guide answers those three questions. It is based on the experience documented by Vernier of teacher Pat Counts, who builds his entire year-long course around a water rocket project with data collection, and translates it to the Chilean context: the Learning Objectives it covers, a March-to-December sequence, the assessment criteria, the safety protocol and the minimum equipment needed to run it.
Which Learning Objectives does a water rocket project cover?
The question any head of studies asks when they see a project like this is a fair one: can it be justified within the national curriculum framework, or is it an extra activity competing with coverage? The answer is that a water rocket project with data collection naturally covers Learning Objectives from three different subjects. It is not an activity running parallel to the curriculum: it is a way of covering it.
CN07 OA 07 · Forces
Plan and conduct an experimental investigation into the effects of gravitational, friction and elastic forces in everyday situations. The school version of the project — build, launch and measure — answers exactly that verb: plan and conduct.
CN2M OA 09 · Motion
Analyse experimentally uniform and accelerated rectilinear motion considering position, velocity and acceleration relative to a frame of reference. That is literally what the motion detector and the video analysis deliver.
CN2M OA 10 · Net force
Explain the effects of a net force on an object using Newton's laws and the free body diagram. The rocket forces students to draw three forces — thrust, weight and drag — and to defend the diagram with data.
CN2M OA 11 · Mechanical energy
Describe motion using the law of conservation of mechanical energy and the concepts of work and power. The energy stored in the compressed air and its conversion into kinetic and potential energy is a complete case study.
CN2M OA 12 · Momentum and impulse
Momentum as a function of impulse, and the law of conservation of linear momentum. The water rocket is the cleanest school example there is: the water goes down and the rocket goes up.
MA2M OA 03 and OA 04 · Quadratic function
Model real situations with the quadratic function and solve second-degree equations. The rocket's trajectory delivers the parabola from the students' own data: vertex, roots and maximum height stop being abstractions.
TE07 OA 01 / TE08 OA 01 · Design
Identify needs and opportunities that call for creating a technological product, then design, build, test and evaluate it. The build–launch–measure–redesign cycle is the full engineering design process.
Elective plan · Grades 11 and 12
The advanced version of the project connects two electives of the differentiated plan: the Physics subject and Computational Thinking and Programming, where the Python model of the rocket's flight is an assessable product in its own right.
On top of this come the scientific inquiry skills objectives, which run across the whole Natural Sciences strand from grade 7 to grade 10: formulating questions and hypotheses, planning and conducting investigations, processing and analysing evidence, evaluating the range of validity of the data and communicating results. A rocket project with sensors does not simulate those skills: it demands them at every stage, because the data belongs to the students and does not always match the model.
A planning advantage: one single project provides coverage in Natural Sciences, Mathematics and Technology, and serves as concrete evidence of interdisciplinary work in the school's educational project.
How does it fit the Chilean school year? A March-to-December sequence
The northern hemisphere calendar does not translate directly to the Chilean one, so here is one possible distribution from March to December, designed for grade 10 and adjustable to grades 7 or 8 by lowering the mathematical demand:
- March to May — Build and launch blind. Intuitive design, first launch, measurement of maximum height and time aloft. The data is kept: it is the year's baseline.
- June to July — Kinematics and Newton's laws. Motion detector and video analysis; free body diagram of the rocket; first model with thrust and weight, no drag.
- August to September — Energy and momentum. Conservation of mechanical energy, impulse and momentum; expelling the water as a case study of the third law.
- October — Measuring drag. The two drag experiments — viscous column and coffee filters — and adding the term to the model.
- November to December — Optimise and relaunch. Redesign based on the simulation, final launch and a presentation comparing prediction with measurement. That report is the unit assessment.
If the school also takes part in STEM competitions, the sequence pays off twice: the same team of students who optimised a rocket with data arrives with a method of their own at any later design challenge, whether vehicles, bridges or drones.
What do students do at each stage of the project?
In the first stage of the course students build their rockets from two-litre bottles, pressurise them with water and compressed air, and launch them while measuring two variables: maximum height reached and time aloft. At that point they do not yet have the physics needed to justify their design decisions, so they build on intuition. Counts does this deliberately: that first rocket is not a teaching failure, it is the baseline against which everything they learn afterwards will be measured.
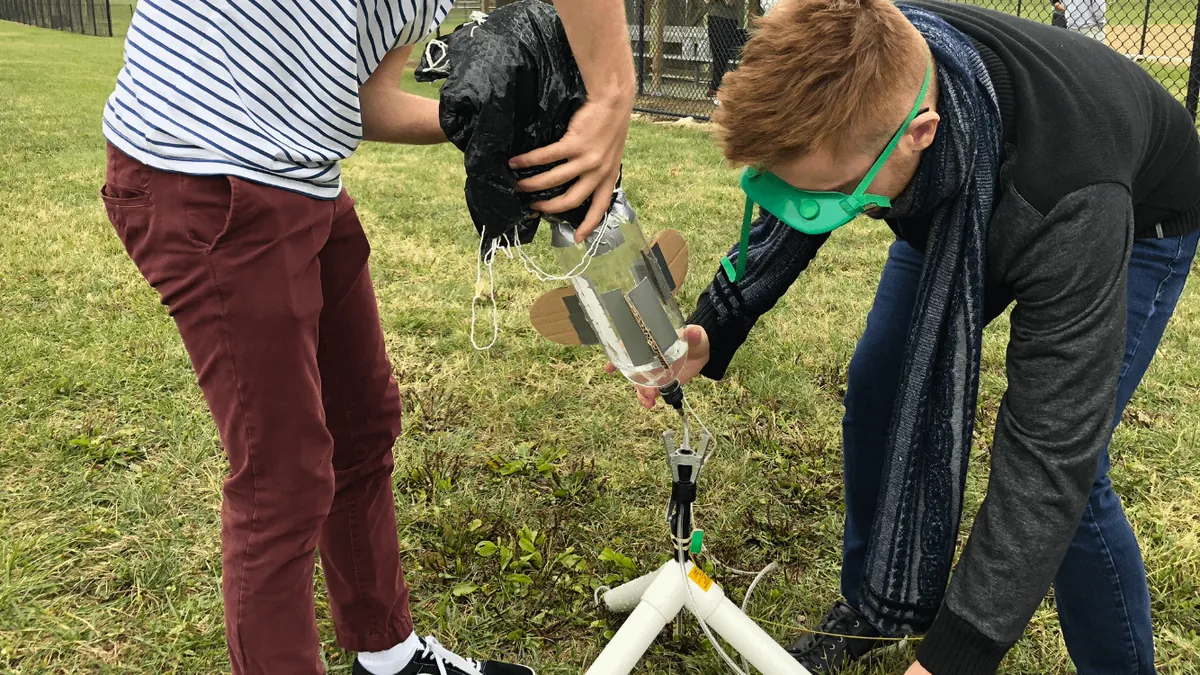
Students build their rockets to explore force and motion in Pat Counts' class. Photograph: Vernier Science Education
As the course advances, students write Python programs that model the rocket's motion using two forces: the thrust generated by expelling the water, and weight. The model produces a predicted trajectory that can be compared directly with the data measured out on the field. The gap between those two curves is what opens up the interesting questions of the year.
The pedagogical point lies in the contrast: the first rocket is built by eye, the last one is built from a model. The difference between them is the year's learning — and it is measurable.
With the evidence gathered over the year, students rewrite their program to simulate the rocket's flight including air resistance. The improved model lets them explore design questions without spending a single bottle: how much water to load, at what pressure, with what fin geometry. Only after optimising in simulation do they rebuild the physical rocket for the final launch of the year.

Every launch is recorded to extract motion data. Animation: Vernier Science Education
Counts describes the launch as a spectacle the class waits for all year: there is cheering when the flight goes as planned and laughter when it does not. But what is assessed is not the cheering — it is the distance between what the model predicted and what the rocket did, and the student's ability to explain that distance with physics.
How do you teach drag force with data instead of a given formula?
After studying rotational dynamics, the class adjusts the rocket fins to improve flight stability. And then the hard question appears — the one usually settled on the board with a formula handed down by the teacher: how does drag force depend on speed? Instead of giving the answer, Counts has his students measure it in two different regimes.
Experiment 1: ball bearings falling through corn syrup
Students drop steel ball bearings into a column of corn syrup and record the fall on video. Using the Vernier Video Analysis app they mark the position frame by frame and obtain position-versus-time data; then they graph drag force against speed. The result that emerges from their own data is that, in the syrup, drag is directly proportional to speed.
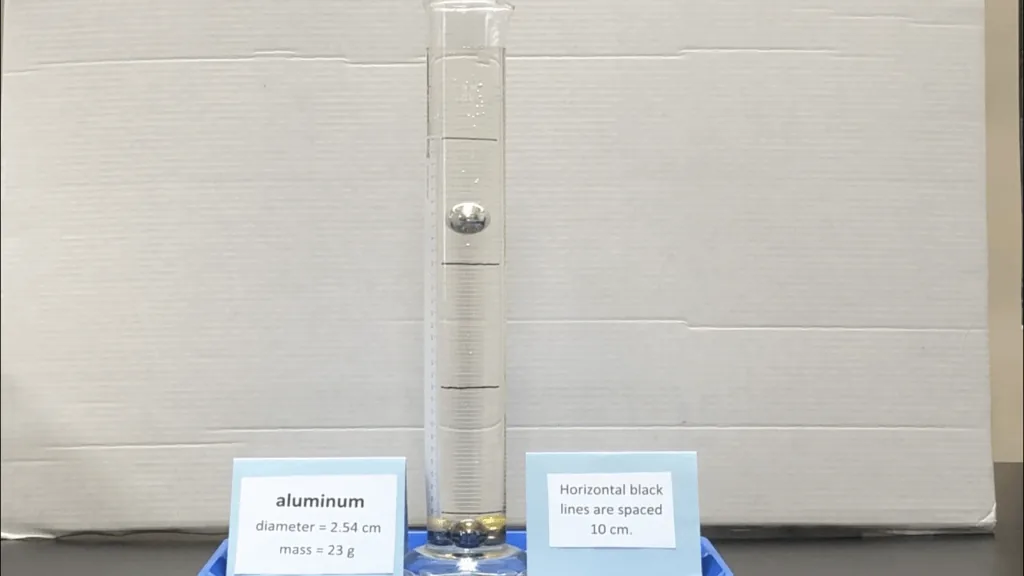
Students observe ball bearings in corn syrup to model drag force. Photograph: Vernier Science Education

With Vernier Video Analysis students mark the position frame by frame and obtain the motion data. Animation: Vernier Science Education
Experiment 2: coffee filters over a motion detector
The second setup is even simpler: stacks of coffee filters dropped over a Vernier motion detector. The sensor records position, velocity and acceleration in real time, and by varying the number of filters — that is, the mass — students gather evidence that drag through air is proportional to the square of the speed. Two experiments, two different physical regimes, and a conclusion the students built rather than copied.
“The water rocket project helps students develop a fuller understanding of drag force.”— Pat Counts, physics teacher at Wyoming High School (Ohio), quoted on the Vernier blog
For the rocket, that conclusion is not a museum piece: it defines the term that has to go into the Python model. Drag stops being a word in a textbook and becomes a line of code with an experimentally justified exponent.
What equipment does the lab need to run it?
The original project started with previous-generation Vernier equipment — a lab interface and Logger Pro — but today the same sequence runs on Go Direct sensors that connect over Bluetooth or USB straight to the student's laptop, tablet or Chromebook, with no interface in between. This is the minimum equipment needed to replicate it:
A school that already owns physics sensors for kinematics needs to buy nothing extra to start. If the lab is being equipped from scratch, the motion detector and the video analysis software cover the whole sequence; the rest can be added in stages. TecnologíasEducativas.cl carries the catalogue with prices for Chile, and every purchase includes teacher training.
How is the project assessed?
The most common objection to classroom projects is that what gets assessed is enthusiasm, or how neat the model looks. Here that is not necessary: because each team produces its own data and a written prediction, assessment can rest on verifiable evidence. These four criteria apply to the final report and work both as a summative unit assessment and as a process rubric:
A practical recommendation: require the prediction to be recorded and dated before the final launch. Without that prior record, the contrast between model and measurement stops being assessable.
Safety protocol for the launch
A water rocket is a pressure vessel and must be treated as one. No project of this kind should be approved without a written protocol; these are the minimum conditions worth setting before the first launch:
- PET soda bottles only, undamaged. Never glass, never bottles that are scratched, punctured, heat-exposed or previously repaired. They are discarded after a limited number of launches.
- Limited, measured pressure. Always use a pump with a gauge and never exceed the limit stated by the launch pad manufacturer; standard school practice stays well below the bottle's burst pressure.
- Launch from a distance. Firing is triggered by cord or remote mechanism, never with hands on the pressurised rocket, and with the class behind a marked line.
- Eye protection and a clear area. Goggles for anyone handling the equipment, an area free of people, windows and power lines, and a vertical launch in open ground.
- Misfire procedure. Decide in advance what to do if the rocket does not lift off: a mandatory waiting time and controlled depressurisation before anyone approaches.
Frequently asked questions
Which year group is the project best suited to?
The full version, with a computational model and drag analysis, fits grade 10 and the grade 11–12 electives. In grades 7 and 8 the same sequence runs without the Python model: build, launch, measure and redesign still covers the forces and Technology objectives.
How many class hours does it take?
Spread as a year-long project it takes between 12 and 16 teaching hours across five moments of the year, without displacing content: each stage coincides with a unit that is already planned. It can also be compressed into a four-to-six-lesson unit if the aim is only to cover force and motion.
Can it be done without sensors?
You can launch without sensors, but you lose precisely what makes the project assessable: the evidence. The minimum floor is video analysis using the students' own phones, which yields position and time data at no equipment cost. The motion detector adds precision and makes the drag experiments possible.
Is it safe to pressurise a bottle with students present?
Yes, with a protocol. PET soda bottles in good condition, a pump with a gauge, remote firing, a marked distance and eye protection. The detail is in the safety section of this article, and it is worth putting in writing and signing off before the first launch.
Do I need to know how to code to run it?
Not for the grade 7 to 10 version. The Python model is the extension for the grade 11–12 electives, and it is the natural point of joint work with the Computational Thinking and Programming teacher. The training included with every purchase covers the data analysis software.
Does it work as an interdisciplinary assessment with Mathematics?
It is one of its most efficient uses: the measured trajectory yields the parabola from real data, so the same report can be assessed in Physics for the force model and in Mathematics for the quadratic fit, the vertex and the roots.
A project that rests on planning, not on enthusiasm
The lesson of Pat Counts' project is not that water rockets are fun — that much was already known — but that data collection turns a showy activity into a rigorous, assessable sequence. Students do not learn that drag depends on the square of speed because the teacher said so: they learn it because they measured it, and because the model they wrote failed for as long as they left it out.
For a Chilean school the entry barrier is surprisingly low: plastic bottles, a couple of Go Direct sensors, free software and a teacher willing to let the first rocket fail. The return is a project that covers Learning Objectives in three subjects, structures the entire year, and leaves students with something no worksheet delivers: the experience of having corrected a model with their own data.
Want to run this project at your school?
We advise you on the Vernier sensors you need and on the teaching sequence aligned to the national curriculum framework. Teacher training included with every purchase. Districalc, official Vernier distributor in Latin America and the Caribbean since 1981.
Contact UsReferences
- Lift Off! Using Water Rockets and Data-Collection Technology to Teach Physics – Vernier Science Education (artículo original)
- CN07 OA 07 – Currículum Nacional, MINEDUC Chile
- CN2M OA 09 – Currículum Nacional, MINEDUC Chile
- CN2M OA 10 – Currículum Nacional, MINEDUC Chile
- CN2M OA 12 – Currículum Nacional, MINEDUC Chile
- MA2M OA 03 y OA 04 – Currículum Nacional, MINEDUC Chile
- TE08 OA 01 – Currículum Nacional, MINEDUC Chile
- Bases Curriculares 3.° y 4.° medio – MINEDUC Chile (PDF)