How clean is the air your students breathe on the way to school? What actually happens in the kitchen when someone cooks dinner on a gas stove? Place-based learning trades the controlled lab for the real world, with all its variability, and Vernier's new Go Direct Air Quality sensor was built exactly for that: it captures fifteen variables at once — particulate matter in three sizes (PM1, PM2.5, PM10), four pollutant gases (CO₂, NO₂, SO₂, ozone), volatile organic compounds, temperature, humidity, pressure and real-time GPS — and takes it wherever students live, learn, or move.
In this article we walk through the sensor, its 15 measurement channels, and three complete investigations — with real data collected by the Vernier team — that you can adapt for your environmental science, chemistry, or AP Environmental Science class: air quality in the kitchen, the neighborhood, and the school commute, turned into original research questions from data students collect themselves.
Why place-based learning changes environmental science
Lab-based environmental science usually works with controlled samples and stable conditions. Real air quality is not like that: it changes with time of day, traffic, weather, the neighbor's cooking, or altitude. Place-based learning has students investigate scientific phenomena in the environments they already know, generating their own questions from data they collect themselves.
This approach is especially powerful for air quality because the phenomenon is invisible: students cannot see CO₂ building up in a closed classroom or the particulate matter released by a hot frying pan. A portable sensor with GPS turns the invisible into a graph, a map, and an authentic research question.
Meet the Go Direct Air Quality sensor
The Go Direct Air Quality is the most complete environmental sensor in the Vernier catalog: a single portable, wireless device that measures particulate matter, polluting gases, environmental conditions, and geographic position. It connects via Bluetooth or USB to Graphical Analysis, Vernier's free software, just like the rest of the Go Direct family.
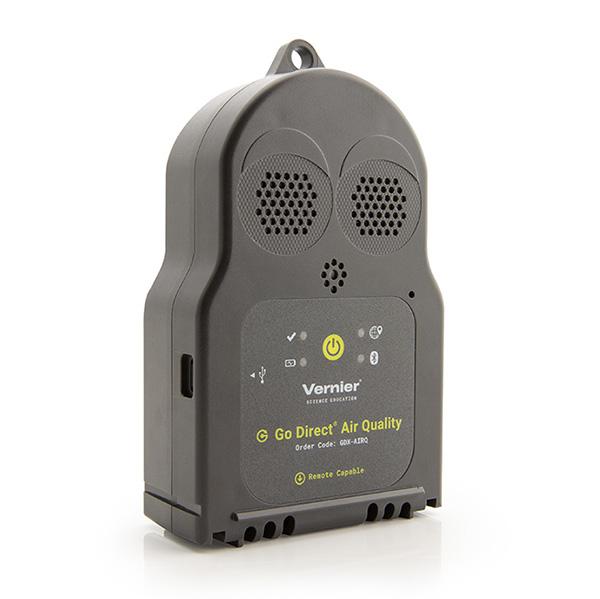
Go Direct Air Quality — portable sensor with 15 measurement channels and built-in GPS
Combining particulates, gases and GPS in a single instrument makes it possible to map the air quality of an entire route, compare multiple locations in the same day, or record exactly where a pollution spike happens, without relying on fixed monitoring stations.
Three investigations with real data
The Vernier specialist team tested the Go Direct Air Quality in three everyday scenarios. These are examples of investigations any teacher can replicate or adapt with their students.
Exploration 1 — Indoor Air Quality and Cooking Emissions
Cooking on a gas stovetop is one of the most common — and least discussed — sources of indoor pollution. Placing the sensor near the stove while dinner was being prepared, CO₂ rose from a baseline under 1,100 ppm to a peak of 1,400 ppm.
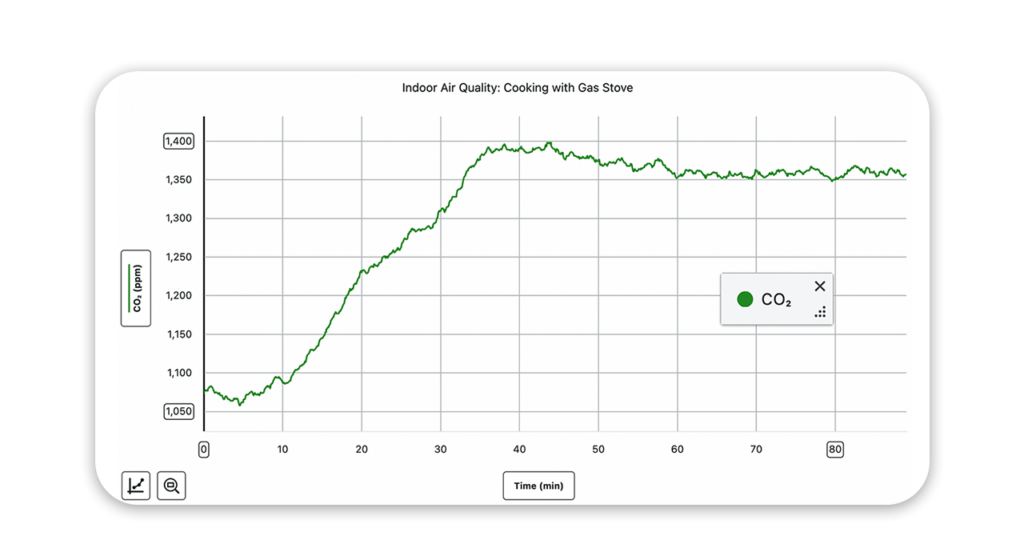
CO₂ during dinner preparation: baseline under 1,100 ppm, peak of 1,400 ppm while cooking
While pan-frying, particulate matter spiked even more dramatically: PM1 reached around 125 µg/m³, PM2.5 exceeded 250 µg/m³, and PM10 passed 400 µg/m³. For context, the EPA considers air quality "good" when average PM2.5 stays below 9 µg/m³ — the levels recorded in the kitchen exceeded that threshold by a factor of more than 25.
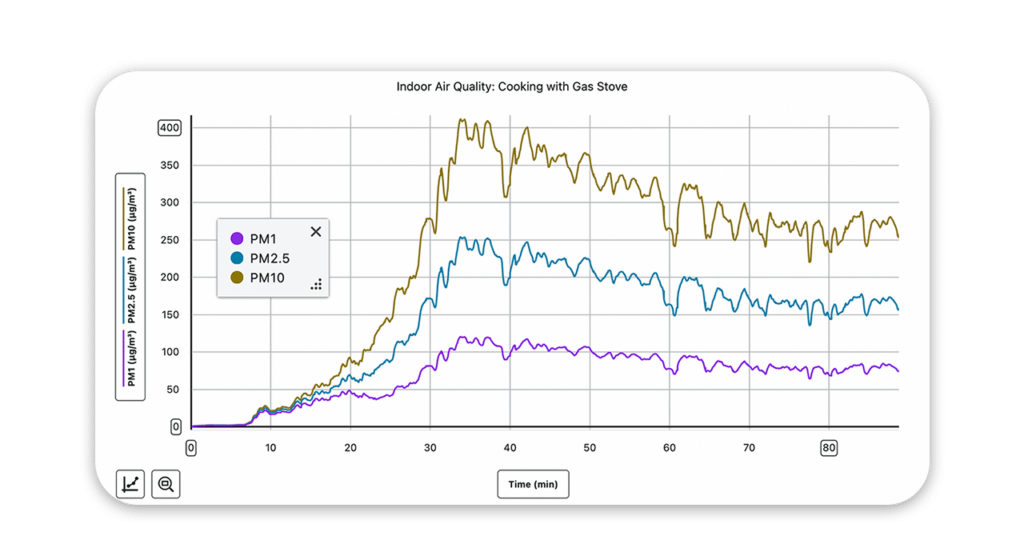
Particulate matter while pan-frying: PM1 ~125 µg/m³, PM2.5 >250 µg/m³, PM10 >400 µg/m³
Possible research questions: does the peak change with stove type (gas vs. induction)? How long does it take air to return to baseline? Does range-hood extraction reduce the PM2.5 peak?
Exploration 2 — Indoor vs. Outdoor Air: Should You Open a Window?
A simple question with a less obvious answer than it seems. Opening a window in a closed space dropped CO₂ from 1,250 ppm to 900 ppm within minutes — a clear improvement, and below the 1,000 ppm threshold several studies associate with declining cognitive performance indoors.
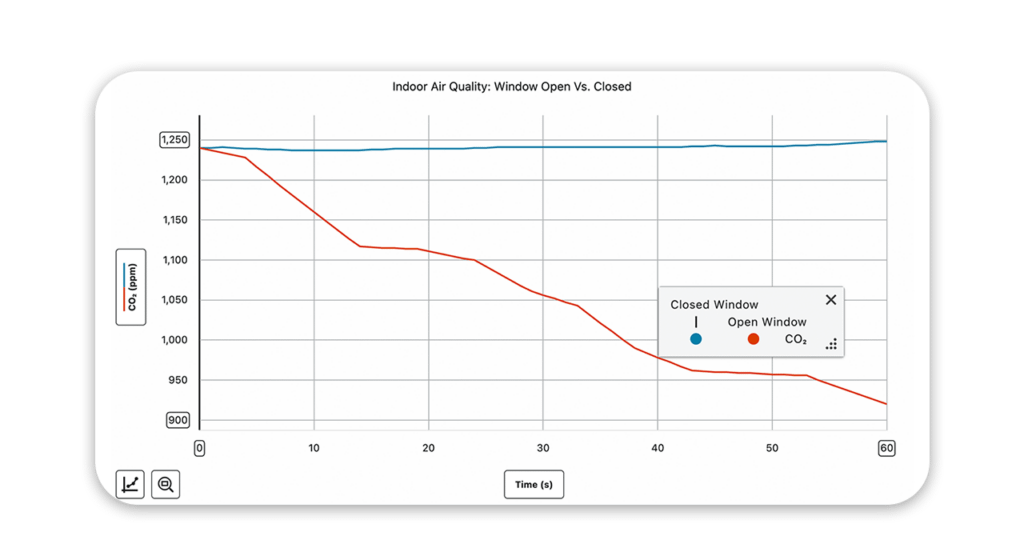
CO₂ drops from 1,250 ppm to 900 ppm after opening the window
But particulate matter told a different story: PM2.5 rose from below 2.0 to over 3.2 µg/m³ after opening the same window, because outdoor air — near a street with traffic — introduced more particles than there had been indoors. Ventilation improves CO₂ but can worsen particulate matter, depending on what is outside.
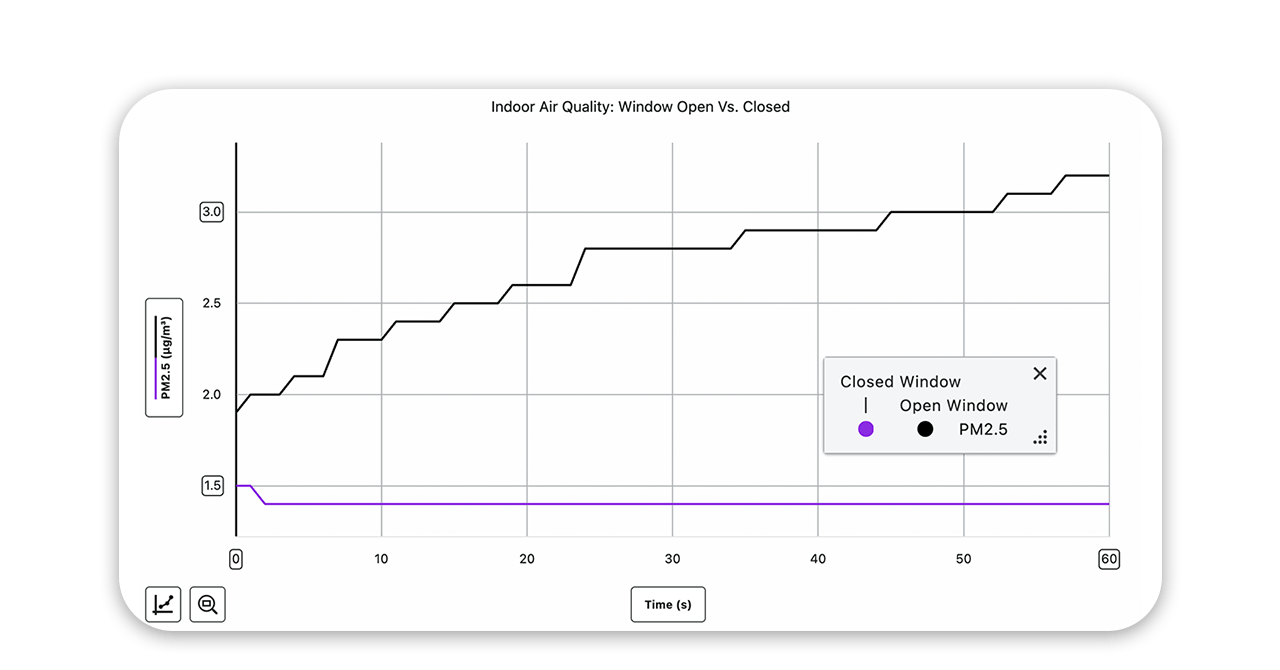
PM2.5 rises from below 2.0 to over 3.2 µg/m³ after opening the same window
This finding is the heart of place-based learning: there is no single correct answer to "should you open the window?" — it depends on which pollutant you care about and what is on the other side of the glass at your specific location.
Exploration 3 — From the LA Basin to 30,000 Feet
To test the sensor's range at larger scale, the Vernier team took measurements at nine locations around the LA basin coastline, with the highest particulate matter levels recorded at Dockweiler and Bolsa Chica.
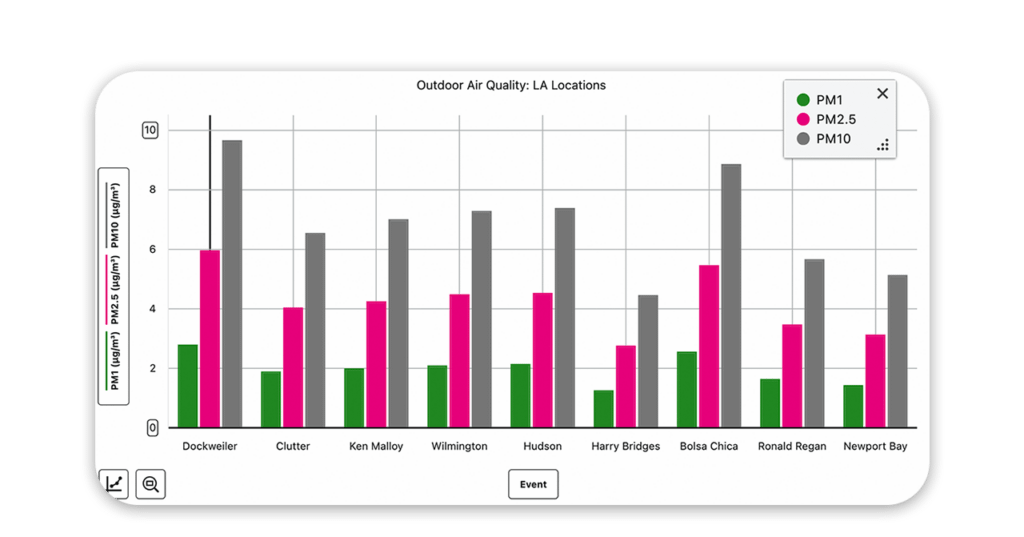
Particulate matter comparison across nine locations along the LA basin coastline
Thanks to the built-in GPS, every reading is anchored to its exact location and can be visualized directly on a map — something impossible with air quality sensors that lack geolocation.
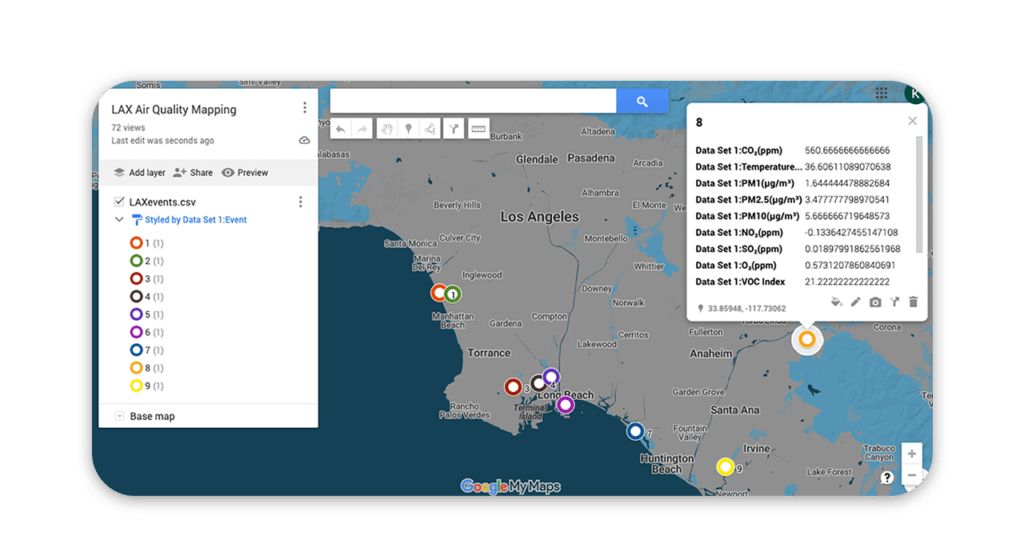
Map of the nine data collection locations, generated automatically from the sensor's GPS
The most extreme test was a full commercial flight from Portland to Los Angeles, with the sensor logging 721 data points across the whole trip. Station pressure faithfully traced the arc of the flight's altitude, while cabin CO₂ stayed elevated — near 2,200 ppm at its peak — and dropped after landing.
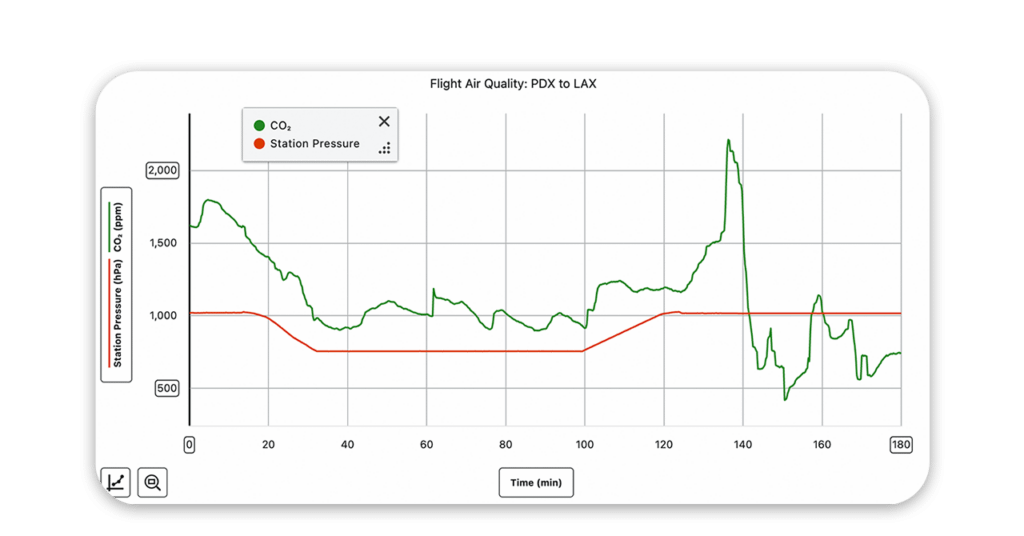
Station pressure tracking the flight arc; cabin CO₂ near 2,200 ppm at its peak
Particulate matter, by contrast, stayed remarkably low throughout the flight — cabin air filtration systems are effective — with brief spikes around minutes 85 and 140, coinciding with passenger boarding and deplaning on the ground.
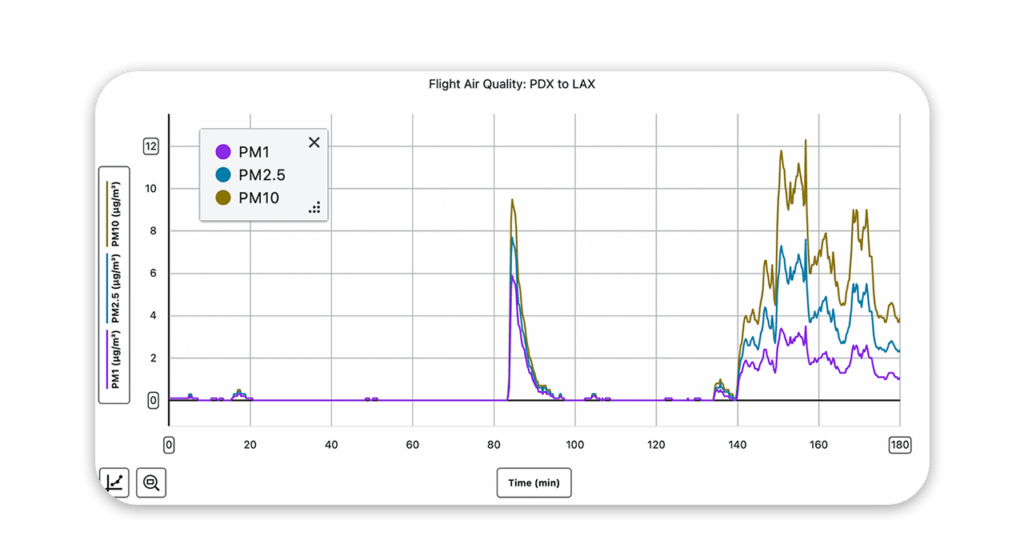
Particulate matter stays low during flight, with spikes at boarding and deplaning (minutes 85 and 140)
All three investigations use the same sensor, the same app, and the same four-step workflow as the rest of the Go Direct family. What changes is the place — and that is exactly what makes each result authentic and specific to each class.
Where it fits in the curriculum
The Go Direct Air Quality is especially relevant for:
- AP Environmental Science: air pollution, indoor/outdoor air quality, public health effects
- AP and IB chemistry and environmental science courses, with NGSS-aligned experiments
- Introductory college ecology or chemistry
- Citizen science projects and community environmental monitoring
Availability and training with Districalc
The Go Direct Air Quality is a recent addition to the Vernier catalog, and like the rest of the Go Direct family, it works immediately with Graphical Analysis with no additional interfaces required. Districalc is the official Vernier distributor for Latin America and the Caribbean since 1981, and every Vernier sensor purchase includes training on the equipment and software.
"What makes the Go Direct Air Quality valuable isn't just how many variables it measures, but that it turns pollution — something invisible — into a data point with a place and a time. That's what transforms an environmental science lesson into a student's own investigation."— Camilo Wartenberg, Director of Districalc
If your institution is evaluating adding air quality monitoring to the science curriculum, contact us: we'll help you define the right package and design teacher training to launch place-based investigations from the first term.
Ready to bring air quality into your classroom?
Contact us and we will advise you on the Go Direct Air Quality sensor and the ideal Vernier package for your institution. Training included with every purchase. Official distributor for Latin America and the Caribbean since 1981.
Contact UsFrequently asked questions
What can I measure with the Go Direct Air Quality sensor?
The sensor measures 15 variables: particulate matter (PM1, PM2.5, PM10), gases (CO₂, NO₂, SO₂, O₃), volatile organic compounds, temperature, humidity, barometric pressure and GPS position. All in a single portable wireless device.
Do I need to be in the classroom to use the sensor?
No. The Go Direct Air Quality is portable and wireless (Bluetooth or USB). The article presents investigations in kitchens, outdoors, on flights and multiple locations, enabling place-based learning in real-world contexts.
Is Graphical Analysis free or does it require payment?
Graphical Analysis free version is the software for Go Direct Air Quality at no additional cost. Data syncs automatically via Bluetooth or USB, can be exported, visualized on maps and shared with Google Classroom.
What devices work with the Go Direct Air Quality sensor?
Compatible with tablets, Chromebooks, phones and computers (iOS, Android, Windows, Mac) via Bluetooth or USB. Works like other Go Direct sensors in the Vernier ecosystem without additional installations or drivers.
What grade levels is this sensor useful for?
It is especially relevant for AP Environmental Science, AP and IB chemistry and environmental science courses, university ecology and place-based citizen science projects. Aligns with NGSS standards.